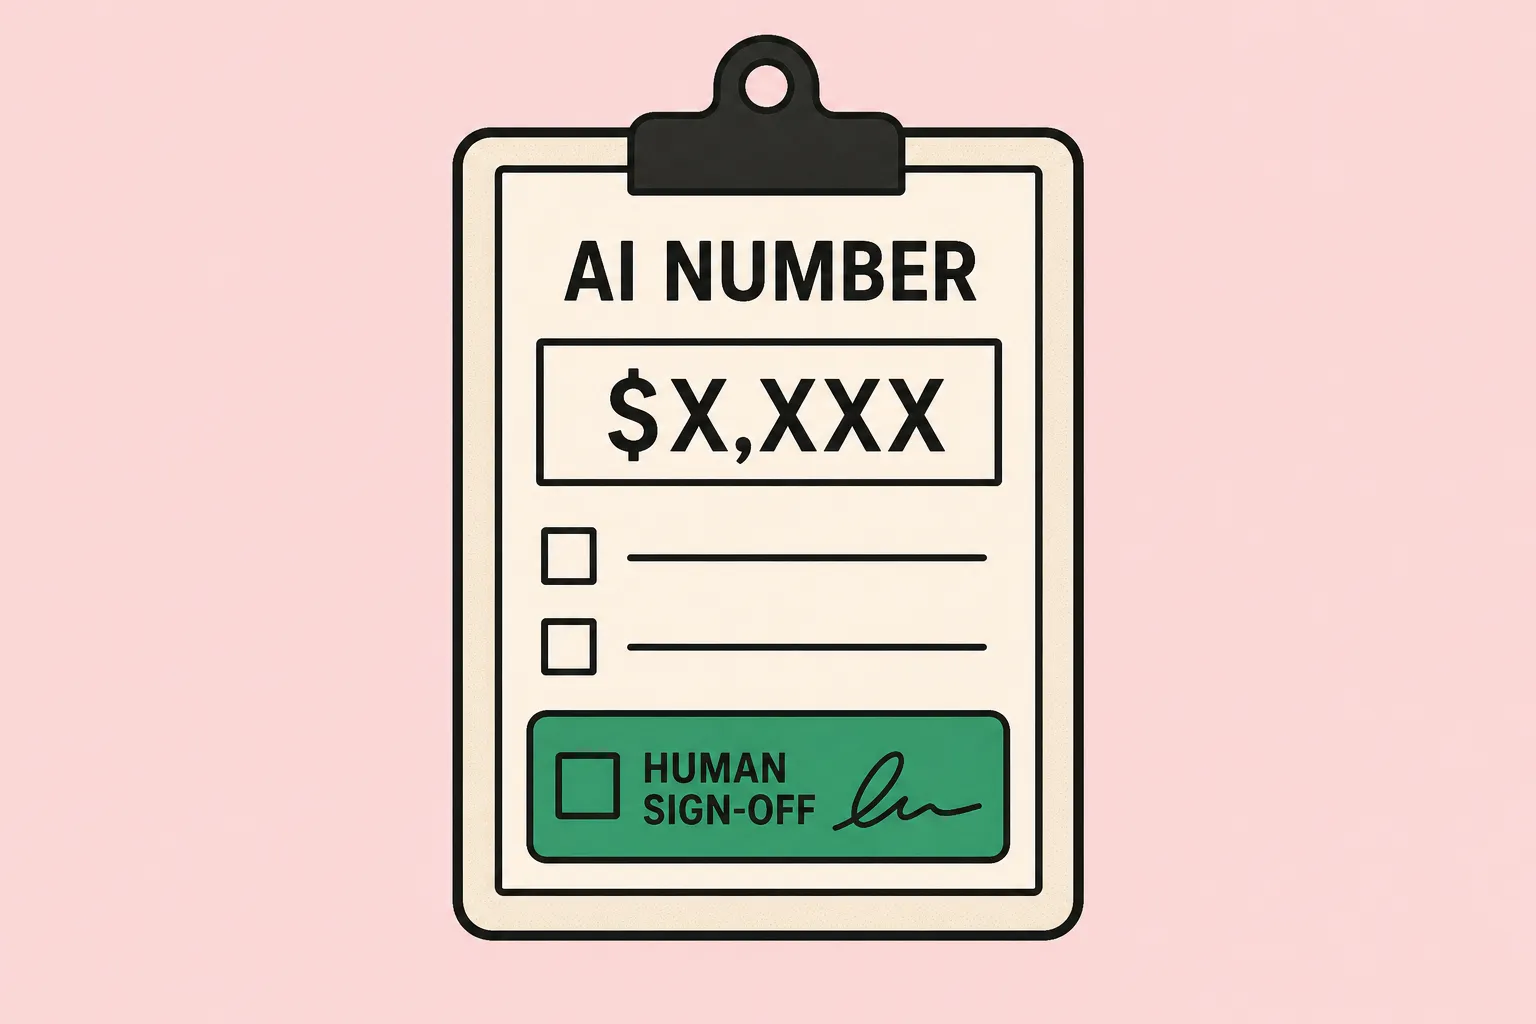
AI Overview exposure, the share of your revenue-driving queries that now return an AI answer, predicts click loss better than position does. When France switched AI Overviews on in July 2026, Ahrefs found the most exposed domains in a 963-site Search Console panel lost close to a quarter of their click-through rate in nine days while their rankings held. Exposure is measurable on data you already own, before the revenue moves.
Flat is supposed to be good news. Rankings held, impressions held, nothing red on the dashboard, so the quarter was fine and the retainer renews. That reading was defensible for about a decade, and it has quietly become the most dangerous sentence in a monthly report, because the thing that moved is not on the page.
A site can keep every position and every impression it had last quarter and still lose a fifth of its clicks. The variable that tells you whether it is happening to you is exposure: the share of your commercially important queries that now carry an AI answer above the results. Damage arrives late. Exposure arrives early, and you can pull it this week.
A report built from supply-side metrics cannot see a demand-side loss
Position, impressions, indexed pages, coverage errors, backlink counts. Every one of those measures supply, meaning how much of you Google is willing to show. AI Overviews attack the demand side instead, by changing whether the click is still needed at all. A report made only of supply-side metrics cannot register that loss until revenue does, which is roughly two quarters after the point where you could have acted.
Australia is already inside that weather system, though the local evidence is publisher-side. Several of Australia's largest news websites have recorded year-on-year declines in organic search traffic since AI Overviews began appearing above results in 2024, some down as much as 35% on SimilarWeb data analysed by the ABC, with AI Mode rolling out here from October 2025. Read that as a traffic trend since 2024, not a click-through-rate reading and not this quarter's news. It establishes the weather without isolating the cause. [AU]
The UK picture is better instrumented and lands closer to a growth-stage P&L. Google organic referrals fell 7.1% across eight major UK publishing groups (147 domains, 10.8 billion pageviews) in the first half of 2025, and inside that panel the consumer and B2B segment fell 18% against roughly 5% a quarter for news, in an Association of Online Publishers study run by DJB Strategies. Google-delivered pageviews are projected to halve by Q3 2027 on that trajectory, though a projection is not a measurement and the AOP is a trade body with an interest in the answer. UK searchers also ended 69.5% of Google searches without a click between January and April 2026, the highest rate SparkToro measured on Similarweb's panel, covering all zero-click behaviour rather than AI Overviews specifically. [UK]
France gave us a launch date, and that changed what we can prove
Attribution has been the problem all along. In most markets AI Overviews crept in alongside core updates and seasonal swings, which bought everyone a year of arguing. France switched them on with a date attached, 22 July 2026, and Ahrefs was already tracking.
The study compares 963 domains in Google Search Console across the 28 days before launch and the nine days after, analysed by Ahrefs data scientist Xibeijia Guan. Panel-wide, click-through rate fell 3.4% in nine days. For the most exposed domains it fell 23.1%, six times as much, and 82.2% of highly exposed domains lost CTR. The control group's CTR rose 2.3% over the same window, so the control-adjusted effect is a 24.8% loss. Exposed sites fell and missed the lift everyone else enjoyed.
Rankings barely moved. The most extreme case recorded 183% more impressions for 1.9% fewer clicks, dividing its click-through rate by more than three. The median deserves equal billing, because over-claiming here is how you lose a CMO: panel-wide it was a 5.7% CTR decline and an 8.8% click decline. Underneath that reassuring median, almost one site in two lost more than 10% of daily clicks and one in twenty lost half, in nine days.
Ahrefs is an SEO tool vendor publishing from its own index, which is worth saying plainly. The design has held up elsewhere, though. A field experiment by Saharsh Agarwal of the Indian School of Business and Ananya Sen of Carnegie Mellon found AI Overviews reduce outbound organic clicks by 39.8% and raise zero-click searches by 34.5%, without touching sponsored clicks. Neither study is Australian or British. The transferable asset is the method, never the 23.1%.
Exposure, not position, is the number that predicts the loss
Across all 963 domains the relationship holds at a slope of 0.9, meaning roughly one point of click-through rate lost per point of exposure. Ahrefs attaches its own caveat, that "a slope is not a prediction", and the caveat is the useful part. Think of exposure the way a lender thinks about flood zoning. It never tells you the house is wet. It tells you which houses to inspect first. Exposure is also climbing: the median AI Overview rate among the domains Ahrefs studied sits at 5.4%, 29% are already above 10%, and the number has moved one way in every market since 2024.
Australian SERPs returned an AI Overview 37.8% of the time in a Digital Nomads HQ benchmark of 116,918 SERPs drawn from more than 1.1 million organic results across 18 industries and six Australian cities, captured on 11 and 12 May 2026. That is agency-published research rather than peer-reviewed work, with sample and confidence intervals disclosed, and exposure barely moved by city. A different lens gives lower numbers. Ahrefs' index-wide count across 108 million AI Overview queries put the share of a country's keywords triggering an AI Overview at 19.1% in the UK and 17.7% in Australia against 20.5% in the US, as of November 2025. Those two figures are not the same metric, so do not average them. Both support the premise you actually need: AU and UK sit within a few points of the US, so the French mechanism is no French anomaly. Read November 2025 as a floor. [AU] [UK]
The intent test decides whether you lose the click
One sector separated itself in the French panel. Health carried the study's highest AI Overview rate at 22.2% and its click-through rate fell 20.4%, consistent with Ahrefs' earlier finding that 44.1% of medical queries trigger an AI Overview. Health queries are informational, they have short answers, and no transaction waits at the end. Ahrefs reads that as intent deciding fate rather than vertical, and the UK topic data agrees: across nine UK newsbrands between January and April 2026, Sistrix measured AI Overview prevalence at 72% for health and 49% for tech against 15% for sport and 5% for football. Sistrix is a tool vendor and that panel is news publishers, so treat it as the upper end of exposure. For health and allied-health providers the ceiling sits higher than almost anyone's, though the French health finding belongs to French clinics. [UK]
So run the test on your own keyword set. A query a single paragraph can answer is a query you are going to lose. A query that needs a tool, a price, an account, a comparison or a human opinion holds up far better. That is a sharper cut than ranking breadth or citation rate, and it needs no new tooling.
Australian B2B data backs the test locally. Australian B2B services SERPs trigger an AI Overview 51.7% of the time (95% confidence interval 50.5% to 52.9%) across 6,495 B2B SERPs, fourth of 18 industries and about 14 points above the national average. Split by intent, the ordering matches the test exactly: informational 69.9%, transactional 63.4%, commercial 47.8%, navigational 31.6%. Adding a suburb, city or "near me" qualifier collapses the rate from 56.6% to 23.0%. Two caveats belong on that slide. Digital Nomads HQ measured trigger rate only and ran no CTR analysis, so it sizes exposure without sizing the loss, and it is currently a single Australian source. No UK equivalent by B2B query intent has been published. [AU]
Pull your exposure rate this week, then change what your CEO sees
Let's make this a reporting change rather than a research project, because you already hold the data.
Segment your revenue-driving queries by intent instead of by page, then pull the share that return an AI Overview, which SERP-feature filtering in most enterprise SEO platforms and rank trackers gives you alongside the clicks and impressions already in Search Console. Put the result on the report as a standing line item beside average position and track its direction monthly. The absolute percentage matters less than the movement, because exposure moves before clicks do. Confirm which interface your tracking reflects before you publish: Google's opt-in Web Guide carried a bug this week where clicking "Classic search" kept users inside the AI-organised interface. Adoption is low, so the direct impact is small, and the warning still stands. A rank tracker and a client-facing SERP screenshot can describe two different Googles.
Then replace the AI number your CEO has probably already seen. Australian businesses have been told AI sessions are up 1,200% year on year at the median, with ChatGPT driving 90.2% of identifiable AI visits, in Optimising's study of 115 Australian businesses. The same study found that traffic converting far worse than organic (a 2.9% purchase rate against 6.0%) and contributing roughly 0.1% of e-commerce revenue. Growth on a tiny base, measuring arrivals, silent on the clicks that never happened. Local agency research has the same shape: Perth's Search Scope analysed 2,400 AI responses across 20 industries this month and Victorian agency Dossis Digital covered 12 trades across four AI platforms in June, both counting how often a domain gets named. Australian agency reporting now measures whether you get mentioned while nobody measures whether you still get the click. [AU]
Which is the honest answer to "has anyone measured this here?". The UK has something. Authoritas research reported by Press Gazette found UK publishers' click-through rate falling 47.5% on desktop and 37.7% on mobile when an AI Overview is present, across 3,500 news search terms tested in April 2025. Three disclosures travel with it: Authoritas is an AI-search platform vendor and a party to the CMA complaint against Google, Google rejected the findings as inaccurate and based on flawed assumptions, and it compares SERPs with and without an AI Overview rather than running a controlled before-and-after. Australia has exposure data and no published click-loss measurement at all. [AU] [UK]
UK readers have one more reason to start a baseline now. The CMA imposed a publisher conduct requirement on Google on 3 June 2026 under its strategic-market-status designation, giving publishers tools to stop their content powering AI features such as AI Overviews, requiring publisher content to be properly attributed with clear links in AI-generated results, and obliging Google to report on compliance every six months for the first year, with nine months to implement. A regulator has now formally separated appearing in an AI Overview from being paid in clicks for it. Whether you use those controls or stay in and fight for the citation is a strategy call, and the compliance reporting will land against a baseline you should already be measuring. [UK]
Australia gets no such forcing function. The ACCC's most recent finding specific to AI in search, the ninth Digital Platform Services Inquiry interim report, concluded that generative AI's impact on market dynamics in general search "appears limited so far" with Google at 94% share, and the inquiry closed in March 2025, before AI Overviews became a measurable click problem here. Australian marketers have to instrument this themselves. The labels for the work are still contested, with Google's position being that good SEO is largely good GEO, so you do not need to win an acronym argument first. You need a number you can defend when someone asks where it came from. [AU]
Key takeaways
- Add AI Overview exposure to the monthly report as a standing line item beside average position, segmented by query intent rather than by page, and report its direction over time.
- Apply the paragraph test to your top revenue queries. Anything answerable in a paragraph is at risk; anything needing a tool, a price, an account or a human opinion holds up better. Australian B2B informational queries trigger an AI Overview 69.9% of the time against 31.6% for navigational ones.
- Stop steering by impressions. In the French panel, rankings and impressions held while the most exposed domains lost close to a quarter of their click-through rate in nine days.
- Treat exposure as a risk indicator, not a forecast. Ahrefs' own caveat is that a slope is not a prediction, and some heavily exposed sites are fine while barely exposed ones struggle for unrelated reasons.
- The client whose report looks cleanest is the one most worth checking, because flat rankings with flat impressions is exactly the pattern that hides a demand-side loss.
Frequently asked questions
What is AI Overview exposure in SEO reporting?
AI Overview exposure is the share of your tracked queries that return an AI Overview in the results. Ahrefs found a slope of roughly one point of click-through rate lost per point of exposure across 963 French domains, which makes exposure a leading risk indicator you can measure before traffic falls rather than a prediction for any single site.
Can rankings stay flat while organic clicks fall?
Yes, and that is the pattern to watch for. In Ahrefs' French study rankings barely moved after AI Overviews launched, while the most exposed domains lost 23.1% of their click-through rate, or 24.8% once the control group's gain is accounted for. The most extreme case recorded 183% more impressions for 1.9% fewer clicks.
How common are AI Overviews on Australian and UK search results?
Common enough that the French findings are relevant here. A Digital Nomads HQ benchmark of 116,918 Australian SERPs found 37.8% returned an AI Overview in May 2026, while Ahrefs' index-wide count put the UK at 19.1% and Australia at 17.7% as of November 2025. Those use different methodologies and keyword sets, so compare them with care.
Has anyone measured AI Overview click loss in Australia or the UK?
In the UK, partly. Authoritas research reported by Press Gazette found UK publisher click-through rates falling 47.5% on desktop when an AI Overview is present, though Authoritas is a vendor and a party to the CMA complaint, and Google disputed the findings. Australia has published exposure data but no equivalent click-loss measurement, which is why local teams need to measure their own.
Start with the number you already own
Your exposure rate sits in data you already pay for, and it is the cheapest place to begin. This is the work Amina does every day: our AI-visibility service measures how often your firm is named across the major AI assistants and closes the gap, so you are the answer when a buyer asks AI about your field.